After my recent migration back to ZFS on Linux, I decided to roll my own GUI for server reporting/management.
Unfortunately, as referenced in the above linked post, I recently picked up some 10TB Seagate drives that refuse to be stable in any ZFS array, except on Linux. It’s worth mentioning that running them on Linux seems to be the fix, as they’ve been 100% stable for weeks now.
While I was a VERY early adopter of ZFS on Linux, in recent years I’ve avoided it. I think part of the reason is the lack of a GUI.
While I don’t need or want a GUI for configuration, for reporting it’s more than helpful. Scanning lines and lines of text for things like smart status is absolutely no fun.
I’ve tried OMV, but I really wasn’t a fan of the interface. It ultimately represents a lot of bloat and most of it I don’t have much use for.
The Core
At the core of the new system is Debian Stretch. I initially tried Ubuntu 18.04, but I found NFS on Ubuntu has a problem. I believe locking to be broken, as I was having problems with Gitlab that has otherwise been running flawlessly over NFS under FreeNAS, OMV, OmniOS CE, and finally bare Debian. There were also other strange locking issues (with ESXi) that I wasn’t able to resolve until switching to Debian (which I guess OMV is).
Other than that, the software stack is simple:
- Debian Stretch with backports. Needed because the ZFS version on Stretch is ancient (.0.6.5). Backports gets version .0.7.9-3.
- zfs-zed. Again from backports. Allows notification of ZFS events (drive failures, scrubs, etc).
- sanoid/syncoid. Simple method of setting up automatic ZFS snapshot management and replication.
- NFS. Pretty straightforward. Despite using NFS for YEARS, I never really understood NFSv4. I finally took the opportunity to learn how the
fsidworks. - Samba. Again, straightforward. I mainly use this for ISOs exports to Supermicro IPMIs and Time Machine.
- smartmontools. Smart monitoring for the connected drives.
- Glaces. This is a great system monitor that has a wonderful web-based API, needed for tapping into for reporting.
- LIO for iSCSI. iSCSI on Linux is… annoying, for reasons I’ll mention in a few lines.
- PHP7.2 (from a PPA), Smarty (php templating system), nginx, and a nice template from Bootstrapmade. Despite any abilities with code, I am completely unable to make something look appealing.
I don’t really have a problem with configuring any of this from the command-line. Most of the things represent a handful of lines of configuration at most.
LIO is simple enough to use, but it took me some time to figure out WHICH iSCSI implementation I should actually be using. There are a number of iSCSI implementations on Debian and they are all active and available. The other ones are mostly maintained for backwards compatibility I think.
The interface for LIO is targetcli, which has a distinct DOS-like feel. It also supports things like tab-completion, which is helpful if you’ve never used it before:

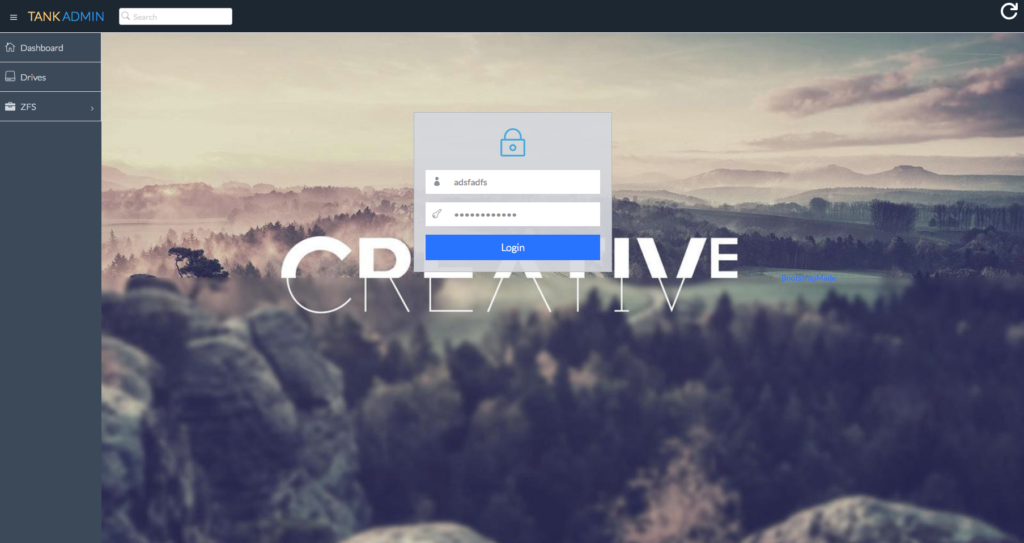
The GUI
I’ve tried (successfully and unsuccessfully) to make web GUIs for server management and reporting in the past. It’s usually not a lot of fun. The hacks required to pull data from the variety of sources generally just makes for super ugly code. For this project, I discovered Glances.
If you’ve never used Glances before, at its core, it’s almost just a “top/htop” replacement. But it also provides a nice web interface that is capable of spitting out JSON.

Of course, this makes it disgustingly easy to create a web application that is capable of pulling all manner of statistics.

That means with a few lines of JQuery,

and using that nice template I mentioned, voilà, a simple dashboard:


Disks
A big reason for buildling this application is to easily monitor smart stats and disk health. Which is something else glances doesn’t cover. I imagine there’s a plugin available for it, but it’s easy enough to pull and parse smartctl output:

ZFS
Anything ZFS related is outside of the scope of glances. I did check around for a third-party plugin a bit, but was unable to find anything. Which means the ARC section:

Needs to come from my own code. Fortunately, this is data that’s easily accessible:

Similar code builds the pool topologies, data structures, health and more from running zpool status/zpool list/etc:

And while sanoid works perfectly, sometimes its nice to be able to visualize snapshots (and remove some manual ones):

The end
In all, I am far more satisfied with this setup than any of the ZFS systems I’ve run in a long time. FreeNAS always felt like a crapshoot whether an update was going to implode my setup, and the support was non-existent when something went wrong in OmniOS.