On almost a daily basis, I am bombarded with ads on Facebook for the Sense. This device allows you to monitor whole-home power consumption.
I could probably find room for such a device in the budget, but I HATE electricity. Too many years of geeky endeavors have resulted in far too many shocks, and mains electricity scares the hell out of me. That discounted the possibility of hooking some kind of sensor to a Raspberry Pi and directly measure the mains.
After I thought about it a bit, I realized it would be extremely simple to do something similar without any wires or hassle.
RTL-SDR
As I considered how I could accomplish this task, I came to a realization. At least where I live, I haven’t seen a “meter reader” in at least a couple of decades. This meant at least once a month, the power company was somehow retrieving my usage in an automated fashion.
Some research told me that the power company accomplishes this via a simple radio broadcast on the 900Mhz spectrum. Once again, it was a task for the RTL-SDR that I use for a number of projects.
The RTL-SDR is just a cheap software-defined radio that can be had for less than $25 on Amazon with an antenna. It can used for everything from monitoring cheap temperature and humidity sensors, tracking airplanes, and apparently, reading my own power meter.
The software is readily available for all flavors of Linux, and simple to install and use.
Meter Reading
It turns out, at least in the United States, most meters can be read using this software. Don’t get me wrong, manually decoding radio packets isn’t necessarily difficult, but it makes me glad that some kind soul has done the legwork for this already.
And with one simple command, I was reading the power (and probably water) meters for my entire neighborhood:
~/gocode/bin/rtlamr -msgtype=idm --format=json -msgtype=scm+

I’m not going to lie. It felt weird polling the meter readings for the entire neighborhood. Out of the five different protocol types (‘msgtype’ option to rtlamr), four of them were in use in my neighborhood, and I had access to hundreds of meters.
The Hunt Begins
Once I was able to poll meters, it became a hunt for the proverbial needle-in-a-haystack to find my meter. Amazingly, this was the longest part of the whole endeavor and ended up taking almost three hours. There were a number of impediments to this goal:
- The meters only report every few minutes, and sometimes sporadically, instead of even on a set schedule. So it becomes a matter of weeding through a few hundred readings to try and pick out your own. Some meters will report two or three times for a single report on another. This becomes important later for why this isn’t the best option for an instantaneous “Hey my house is currently using 150 Wh” reading.
- In my neighborhood, there are four different protocols in use. This meant I had to repeat the first step for all four protocols.
- The reading that’s reported when you look at the physical meter isn’t the same reading that’s reported wirelessly.
That third point is obviously a huge problem when you are flying blind. My meter was reading 55,151 kWh, so my eyes were scanning for a five digit number in the mess. And of course searching the output wasn’t helping because by the time I got a reading (due to point #1 above), the number had moved.
Of course this is when I realized that the wireless reading from the meter was reporting in daWh (that’s decawatt/hours). With that knowledge, I was able to identify my own meter. Fortunately, the rtlamr binary provides a simple way to filter by a specific unit, output json, and grab a single packet:
~/gocode/bin/rtlamr -msgtype=idm --format=json --filterid=XXXXXXX --single=true

55422.79 kWh used since my meter was replaced a few years ago. I imagine there is some other useful information in there, like the PowerOutageFlags, DifferentialConsumptionLevels, and more. But for now, I had my reading.
Graph All the Things!
Once I had JSON output, the sky is the limit for what can be accomplished. My first reaction was to drop it in InfluxDB and use Grafana. Unfortunately this method of reading the meter doesn’t really lend itself well to constant polling. There are a few important things to notice in the following output:

- The readings didn’t actually change between every report. For example, three successive readings might be the same (despite many watt/hours in use), but only the fourth reading would report the ultimate change.
- The time between reports really inconsistent. One time would be two minutes, the next would be a single minute. I imagine it’s done this way to stagger out the signals in a neighborhood so they aren’t clambering over one another. This meant my RTL-SDR was constantly polling for meter reading, which broke my temperature/humidity sensors for my fridge, monitoring the basement for water, and more.
While I’ve seen some nice looking Grafana graphs, most of the time I really don’t think they look that nice. Sometimes they remind me a bit of “rrdgraph”.
Functional, sure, but they really just look terrible compared to a modern HTML5 graphing library. Not to mention, I always waste a ton of time fighting with Grafana trying to get it to even report “sane” numbers.
This also immediately discounted the idea of creating some sort of instantaneous usage report. The meter wasn’t changing often enough to even get a minute-by-minute report. So I ditched Grafana and went with a simple relational database and some PHP.
PHP, SQLite3, and JQuery
I use PHP. There, I admitted it. For heavy projects, I prefer something different. But as I’ve been using PHP professionally since the PHP/FI days, it lends itself to extremely rapid development. And at least for quick and dirty home-tasks where I’m starting from scratch every time, some spectacularly ugly code.
That’s why I usually don’t post code examples, because I don’t care how anybody could do it better, why my code sucks, is a security blight or whatever else. It’s quick (I’ve only got a few hours of time in the code of this project), it’s dirty, it usually gets super creepy and crufty as I change directions 42 times, and I’m not exposing it to the Internet. With that warning out of the way…
Data Collection
I decided I wanted a relational database, but didn’t want to mess with some heavy daemon. While it’s running on my “collection” host, an N3700 with an SSD in it, at some point in the future this could run off a Raspberry Pi. SQLite3 was the only choice as it is lightweight and fast.
A simple cron script set up to run every hour on the hour captures the meter reading:
$unitid = XXXXXX;
$type= "idm";

exec("/scripts/gocode/bin/rtlamr -msgtype={$type} --format=json --filterid={$unitid} --single=true",$output);
$arr = json_decode(implode("\n",$output),true);
$meter_reading = $arr['Message']['LastConsumptionCount'];

if ($meter_reading > 1) {
     $r = new \reading($meter_reading);
}
And the class that actually does the heavy lifting
class reading {

         private $db = null;
         private $reading = 0;

         private function getDb() {
             $db = new SQLite3(dirname(__FILE__) . '/whole_home_electricity.sqlite3');
             $db->query("CREATE TABLE IF NOT EXISTS byhour (id INTEGER PRIMARY KEY ASC, ymd integer, hour tinyint, reading bigint,last_difference integer,UNIQUE(ymd,hour))");
             $db->query("CREATE TABLE IF NOT EXISTS byday (id INTEGER PRIMARY KEY ASC, ymd integer, reading bigint,last_difference integer,UNIQUE(ymd))");
             $db->query("CREATE TABLE IF NOT EXISTS bymonth (id INTEGER PRIMARY KEY ASC, ym integer, reading bigint,last_difference integer,UNIQUE(ym))");
             $db->query("CREATE TABLE IF NOT EXISTS byweek (id INTEGER PRIMARY KEY ASC, year integer, week tinyint, reading bigint,last_difference integer,UNIQUE(year,week))");
             return $db;
         }

         private function getLastReading($table) {
             $ld_res = $this->db->query("select * from {$table} order by id desc limit 1");
             if ($ld_row = $ld_res->fetchArray()) {
                 return $this->reading-$ld_row['reading'];
             }
             return 0;

         }

         public function __construct($reading) {
             $this->db = $this->getDb();
             $this->reading = $reading;


             $ym = date("Ym");
             $year = date("Y");
             $week = date("W");
             $ymd = date("Ymd");
             $hour = date("H");

             //By Hour
             $res = $this->db->query("select * from byhour where ymd={$ymd} and hour={$hour}");
             if (!$row = $res->fetchArray()) {
                 $last_difference = $this->getLastReading("byhour");
                 $ins=$this->db->prepare("insert into byhour (ymd,hour,reading,last_difference) values (:ymd,:hour,:reading,:last_difference)");
                 $ins->bindValue(':ymd', date("Ymd"), SQLITE3_INTEGER);
                 $ins->bindValue(':hour', date("G"), SQLITE3_INTEGER);
                 $ins->bindValue(':reading', $this->reading, SQLITE3_INTEGER);
                 $ins->bindValue(':last_difference', $last_difference, SQLITE3_INTEGER);
                 @$ins->execute();
             }
             //End By Hour


             //By Day
             $res = $this->db->query("select * from byday where ymd={$ymd}");
             if (!$row = $res->fetchArray()) {
                 $last_difference = $this->getLastReading("byday");
                 $ins=$this->db->prepare("insert into byday (ymd,reading,last_difference) values (:ymd,:reading,:last_difference)");
                 $ins->bindValue(':ymd', $ymd, SQLITE3_INTEGER);
                 $ins->bindValue(':reading', $this->reading, SQLITE3_INTEGER);
                 $ins->bindValue(':last_difference', $last_difference, SQLITE3_INTEGER);
                 @$ins->execute();
             }
             //End Day
             //
             //

             //By Week
             $res = $this->db->query("select * from byweek where year={$year} and week={$week}");
             if (!$row = $res->fetchArray()) {
                 $last_difference = $this->getLastReading("byweek");
                 $ins=$this->db->prepare("insert into byweek (year,week,reading,last_difference) values (:year,:week,:reading,:last_difference)");
                 $ins->bindValue(':year', $year, SQLITE3_INTEGER);
                 $ins->bindValue(':week', $week, SQLITE3_INTEGER);
                 $ins->bindValue(':reading', $this->reading, SQLITE3_INTEGER);
                 $ins->bindValue(':last_difference', $last_difference, SQLITE3_INTEGER);
                 @$ins->execute();
             }
             //End Week

             //continues for month, and eventually year


             //While we are at it, back everything up with "versioning"
             //Backup

             if (file_exists("/mnt/Backups/backup_mounted")) {
                 for ($i = 48; $i > 0; $i--) {
                     $a = $i - 1;
                     rename("/mnt/Backups/analog/whole_home_electricity/whole_home_electricity.sqlite3.{$a}", "/mnt/Backups/analog/whole_home_electricity/whole_home_electricity.sqlite3.{$i}");
                 }
                 rename("/mnt/Backups/analog/whole_home_electricity/whole_home_electricity.sqlite3","/mnt/Backups/analog/whole_home_electricity/whole_home_electricity.sqlite3.0");
                 copy(dirname(__FILE__) . '/whole_home_electricity.sqlite3',"/mnt/Backups/analog/whole_home_electricity/whole_home_electricity.sqlite3");
             }
The theory behind this is simple. Once an hour, pull a reading. If a reading doesn’t exist for the current day, hour, week, month, year, pull the last reading, grab the difference, and store it.
Weird alert
This does create an oddity as the datapoint for 20171217 09 actually represents the data for 08:00-09:00. Similarly this occurs for day, week, and month. It’s not a huge problem, but it just means that when I pull a day’s worth of data, I pull where the hour>0 and then the following day’s hour=0. It’s just a slight modification on the output. One of those crufty things born out of a change of direction that I should probably go back and change (but never will).
The Output
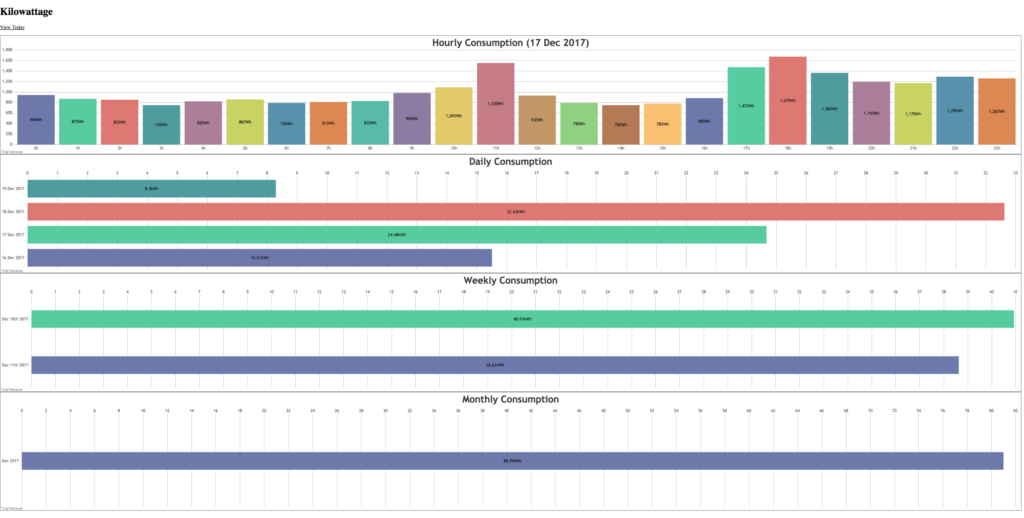
The output is just a simple HTML5 page that calls a json-generating PHP script via JQuery/ajax. The result ends up looking something like this:

I’ve used all sorts of frameworks and APIs over the years, but I can’t speak highly enough of CanvasJS.
It’s not free, and I’ll probably end up buying a license so I can use it here and elsewhere. It’s by far the easiest to use and nicest-looking framework for generating graphs I’ve used in a while.
In any case. Actual HTML for this is fairly straightforward:
Kilowattage
Without getting bogged down with details, the crux of this is pretty simple:
Check to see if we want to grab a specific day. This is so I can click on the day and get the specific usage for that day (and reload the chart):
var postvars = { action: "byhour"}; if ($.urlParam('byHourDay') != 0) { postvars.byHourDay = $.urlParam('byHourDay'); }Do an AJAX post to api.php. Parse out the results and put them in an array of data points:
    $.post( "api.php", postvars, function( result) {
        result = $.parseJSON(result);
        points = [];
        $.each(result, function (i,v)
        {
              points.push({y:v, label: i+"h", indexLabelFontColor: "#000000",indexLabelPlacement:"inside", indexLabel:"{y}Wh"});
        });
Build the chart and change some text around so we know we are looking at a different day
chart_title = "Hourly Consumption";
if (postvars.byHourDay) {
            chart_title += " (" + decodeURIComponent(postvars.byHourDay) + ")";
            $("#goback").fadeIn(600);
        } else {
            chart_title += " (today)";
        }

        var hourOptions= {
        theme: "light2",
        animationEnabled: true,
        title: {
            text: chart_title
        },
        data: [{
            type: "column", //change it to line, area, bar, pie, etc
            dataPoints: points
            }]
    };

    $("#byHourContainer").CanvasJSChart(hourOptions)
    });
}
This repeats for the day, week, month, and eventually year. With this, I can click on the day under the daily charts, and have it refresh the hourly chart with the new day/
The API
Finally, I needed an API to connect the HTML to the Sqlite3 database.
Stuff like this is where I always end up missing some of the heavier frameworks I’ve developed and I used on a daily basis.
I’m just reading the most recent backup copy of my database, to prevent locking issues; I only want to do something if my Backup drive gets mounted:
if (file_exists("/mnt/Backups/backup_mounted")) {
    $usage = new \usage();
    if (!empty($_POST)) {
        if ($_POST['action'] == 'byday') {
            echo json_encode($usage->getByDay());
        }
        if ($_POST['action'] == 'bymonth') {
            echo json_encode($usage->getByMonth());
        }
        if ($_POST['action'] == 'byWeek') {
            echo json_encode($usage->getByWeek());
        }
        if ($_POST['action'] == 'byhour') {
            $byHourDay = strlen($_POST['byHourDay']) > 0 ? urldecode($_POST['byHourDay']) : null;
            echo json_encode($usage->getByHour($byHourDay));
        }
    }
}
Just a simple director. Call a method depending on URL parameters.
This is where it gets pretty crufty. I was in the home stretch and just wanted to be done. Here’s what some of the functions look like:
class usage {

    private $db = null;

    public function __construct() {
        $this->db = new SQLite3("/mnt/Backups/analog/whole_home_electricity/whole_home_electricity.sqlite3");
    }

        public function getByDay($limit = 10) {
        $ret = [];

        $ld_res = $this->db->query("select * from byday order by ymd limit {$limit}");
        while ($ld_data = $ld_res->fetchArray()) {
            $fdate = date("j M Y",strtotime(($ld_data['ymd']-1)));

            ##in decawatts, want kilo
            $ret[$fdate] = $ld_data['last_difference']/100;
        }

        ##Add in today's usage since it hasn't been written yet
        $fdate = date("j M Y");

        $tot = 0;
        $byhour = $this->getByHour();
        foreach ($byhour as $usage) {
            $tot += $usage;
        }

        ##Swap the watts back to kilo
        $ret[$fdate] = $tot/1000;

        return $ret;
    }

    public function getByHour($date = null) {

        ##Pull today if nothing passed in
        if ($date == null) {
            $date = date("Ymd");
        } else {
            //format that guy
            $date = date("Ymd",strtotime($date));
        }

        ##This addresses the problem where I am writing the previous hour's data to the current hour
        $tomm = $date+1;

        $ret = [];

        ##Usage is marked current hour when it actually means last hour
        ##so do some fanangling
        $ld_res = $this->db->query("select * from byhour where ((ymd={$date} and hour > 0) || (ymd={$tomm} and hour=0)) order by ymd,hour");
        while ($ld_data = $ld_res->fetchArray()) {
            $hour = $ld_data['hour'] - 1;
            if ($hour < 0) {
                $hour = 23;
            }
            //convert to watts
            $ret[$hour] = $ld_data['last_difference']*10;
        }

        ##Fill in blanks spots with "0" in the final output so we have a full 24 hours worth
        for($i=0; $i < 24; $i++) {
            if (!isset($ret[$i])) {
                $ret[$i] = 0;
            }
        }
        ksort($ret);
        return $ret;
    }
And that’s that!
The Results
The end result is a decent looking set of graphs that can be manipulated a bit. I’ve only just got full data collection going, so it will be a few weeks before the graph truly fills out and becomes interesting.

And some fun things emerge:

and:

Ending thoughts and To-dos
This was a fun little project that really didn’t take me much time. Now that I’m collecting the data, I’ll be able to build out the reports a bit more.
The next big thing on my list for this is to include my lab power consumption as a stacked graph, so I can see how much of actual usage is my lab (400+ watts).